1、Prometheus的安装
下载地址:https://prometheus.io/download/

下载好之后进行解压。如下图所示:

双击prometheus.exe即可启动prometheus。
之后我们打开浏览器输入http://localhost:9090,显示如下界面即启动成功

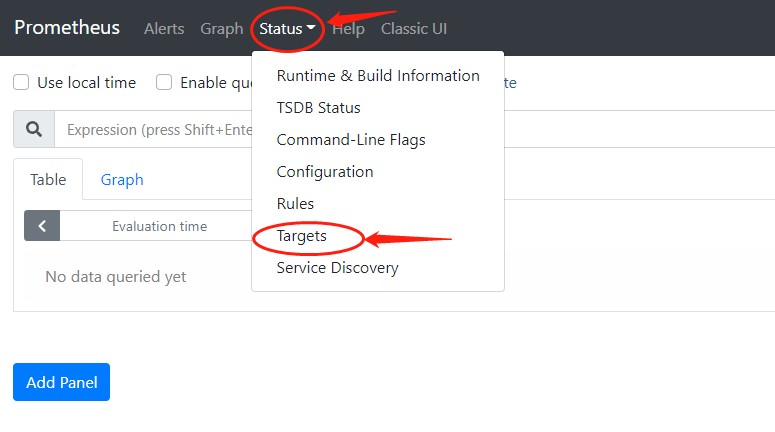
Targets界面如下图所示。

2、grafana的安装
下载地址:https://grafana.com/grafana/download?platform=windows

下载完毕后进行解压,解压结果如下:

启动程序在bin目录中。

这里的客户端应该就是我们去操作grafana-server的一些服务吧。grafana-server就是我们的web端,双击打开即可。
随后打开浏览器输入http://localhost:3000即可进入grafana
初始的登陆账户和密码是:admin/admin
随后便会要求设置初始密码。
grafana页面基本如下。

现在我们要监控prometheus,但是grafana还么有跟prometheus建立联系,那么作为数据源,需要设置一下数据源。


点击Prometheus 2.0 Stats 即可查看,效果图如下所示:

3、监控windows机器
windows_exporter下载地址:https://github.com/prometheus-community/windows_exporter/releases

(1)被监控windows机器安装windows_exporter,会自动创建一个开机自启的服务

接下来的操作都是服务器端得操作:
服务端机器打开prometheus.yml配置文件

在配置文件后面加上
|
1
2
3
4
|
- job_name: '152' static_configs: - targets: ['192.168.199.152:9182'] |
如下图所示(切记格式一定要正确,错误的格式将会无法启动或者无法在表中显示)

重启Prometheus服务即可生效
导入新的表盘
dashboards网址:https://grafana.com/grafana/dashboards


导入监控的表盘

我已经导入过了,所以会这样显示
监控视图如下所示

转自:https://www.cnblogs.com/cghuang/p/15384847.html